


Solutions
Explore how to grow

Your business does not have a data problem. It has a reading problem.
Need help with this? Get to know our digital marketing service.
Every week metrics come in from GA4, Shopify, WooCommerce, Google Ads, Search Console, the CRM and stray spreadsheets. The team sees numbers. Management sees reports. But almost no one sees a clear story about what is working, what is draining margin and where growth is stalling.
That is where the right question about what Looker Studio is comes in. It is not "another dashboard tool." It is a way to organize digital operations so that marketing, eCommerce and leadership stop debating different versions of reality. When that happens, the conversation changes. It no longer revolves around screenshots, but around decisions.
A typical Chilean eCommerce already reviews sales in Shopify or WooCommerce, campaigns in Google Ads, traffic in GA4 and leads in the CRM. The problem shows up in the commercial meeting. Each area arrives with valid figures, but with incompatible readings. So time is lost debating which number counts, instead of deciding what to fix.
That friction hits harder in Chile. Between update lags, manually built reports and the pressure to understand what is happening by district, city or area for GEO-SEO, the operation ends up with a lot of tactical visibility and little executive clarity. In B2B the same thing happens under another name. There are forms, pipeline and active campaigns, but it is hard to see which channel brings real opportunities and which ones just inflate volume.
Measuring is no longer enough. What holds back growth is having a different version of the business in each platform.
Google Ads reports clicks and cost.
GA4 shows sessions and events.
Shopify or WooCommerce record orders, tickets and cart abandonment.
The CRM stores commercial progress and the actual close.
Each system does its job. None of them organizes the leadership discussion on its own.
When that reading is split, costly mistakes appear. Investment is increased in campaigns with apparently good ROAS, but with weak margins due to discounts, shipping or returns. The site is adjusted because of a drop in conversion, even though the problem comes from poor segmentation or low-quality traffic. In B2B companies, marketing celebrates leads while sales keeps complaining that they do not close.
Practical rule: if marketing, eCommerce and management use different reports to defend decisions, the business still operates without a common reading.
The question about what Looker Studio is matters when the company needs to align judgment, not just visualize data. Its value for a commercial manager, a head of eCommerce or a marketing director lies in turning scattered metrics into a useful conversation about profitability, demand and priorities.
That changes concrete decisions. It makes it possible to detect whether a category sells a lot but leaves little margin. It makes it possible to see whether a campaign brings volume in Santiago, but does not add growth where the brand needs local presence for GEO-SEO. It makes it possible to compare acquisition, conversion and close without waiting for someone to consolidate spreadsheets at the end of the month.
Looker Studio helps organize that shared reading. But it is best to enter with the right expectations. If the sources are misconfigured, if Shopify, WooCommerce or the CRM use different criteria, or if data latency prevents reacting in time, the dashboard will only make the disorder more visible. Clarity does not come from the chart. It comes from a serious definition of KPIs, sources and owners.
Looker Studio works best if you think of it as a universal translator. It takes data born in different systems, with different logics, and presents it in a language that leadership can actually use.
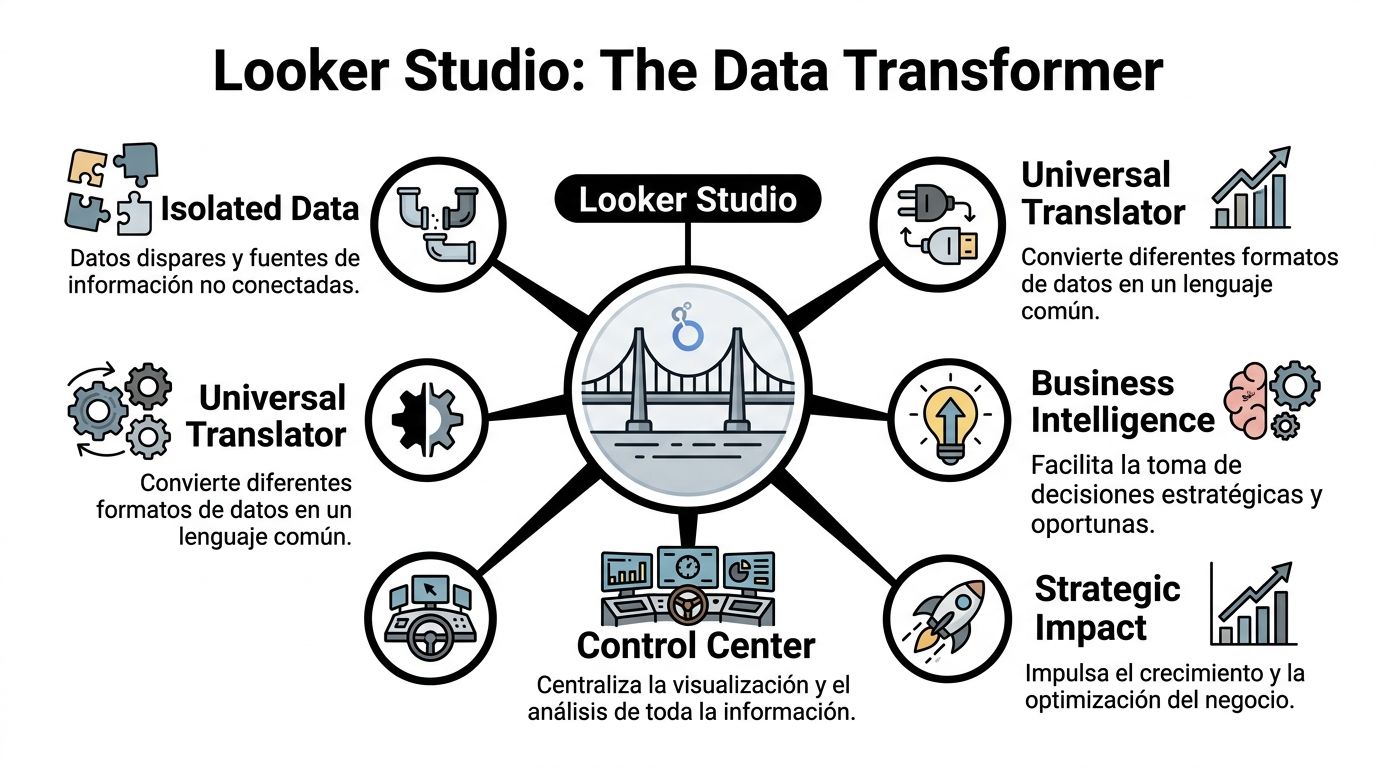
A dashboard on its own changes nothing. What changes operations is the ability to relate variables that previously lived apart.
For example, when a team brings together advertising investment, browsing behavior and actual sales, it stops looking at vanity metrics. It starts reading profitability, friction and traffic quality in one place.
That matters because Looker Studio, by integrating natively with BigQuery, can process more than 1 TB per day and enable real-time testing. According to Training IT, that combination can raise conversion rates between 12% and 15% on high-traffic landing pages, in addition to reducing manual errors by 40% by optimizing the joining of datasets.
Before that unification, reporting tends to be reactive. Someone requests figures. Someone exports. Someone corrects. Someone presents late.
Afterward, reporting becomes a permanent layer for reading the business.
A good dashboard does not answer "what happened." It answers "what should we do now."
That is the difference between reporting and intelligence. The first documents. The second directs.
Most articles about what Looker Studio is stay on the obvious. Connect Google Analytics. Connect Sheets. Make charts. That helps little if you sell online and are under margin pressure.
In Chile, the strategic point is in the integrations with the platforms that really sustain digital operations. According to the reference cited in this analysis of Looker Studio and eCommerce, 68% of eCommerce stores use Shopify and the average conversion rate is 1.8%. That data completely changes the conversation. The problem is usually not attracting visits. It is converting them efficiently.
When you connect Shopify or WooCommerce with GA4 and Google Ads, the real map of the business appears. You no longer see only sessions or purchases. You see the sequence between acquisition, behavior and result.
That makes it possible to answer questions that truly matter:
The same reference indicates that connecting order and cart data with GA4 and Ads makes it possible to visualize funnels in real time and has been shown to reduce CPA by up to 25% to 30% in regional cases.
Many teams still look at Ads on one side and sales on the other. That model produces management friction. The paid media area defends volume. The eCommerce area complains about conversion. No one resolves the cause.
To organize that measurement layer, it helps to have a clean base from the tracking. If that point is messy today, it is worth reviewing a more structured perspective on Google Tag Manager and its role in consistent measurement.
If your store depends on Shopify or WooCommerce, a generic dashboard is not enough. You need a business reading connected to checkout, investment and real performance.
A leader does not need twenty reports. They need a few reports that force decisions.

I would call the first dashboard the health of the digital business. Not because it looks nice, but because it avoids useless meetings. There, sales, conversion, sessions, average ticket and performance by period should coexist. Its function is simple. To detect quickly whether the business is growing in a healthy way or buying growth.
The second report should focus on channel performance. Not to reward the channel with the most traffic, but to identify the traffic with the most value. The executive goal is not "more visits." It is more revenue of better quality.
The third is the purchase behavior report. This one tends to be the most uncomfortable and the most useful. It exposes the stretch between interest and action. It shows which products attract, which paths convert and where the process starts to lose intent.
| Report Type | Strategic Business Question | Key KPIs to Monitor |
|---|---|---|
| eCommerce Health | Are we growing efficiently or just increasing volume? | Sales, conversion rate, sessions, average ticket |
| Channel Performance | Which traffic source generates real value for the business? | Revenue by channel, cost, ROAS, session quality |
| Purchase Behavior | Where does intent break before conversion? | Product views, cart abandonment, checkout steps, purchases |
An executive dashboard does not exist to "have visibility." It exists to prompt concrete actions.
If you want to see how that logic translates into a more business-oriented system, this guide on a digital conversions dashboard helps you understand what a growth team should look at and what is superfluous.
The right report does not give you more data. It takes away your excuses.
The free version is enough for many companies. But not for all. When the business grows, the discussion stops being visualization and becomes governance, speed and operational consistency.
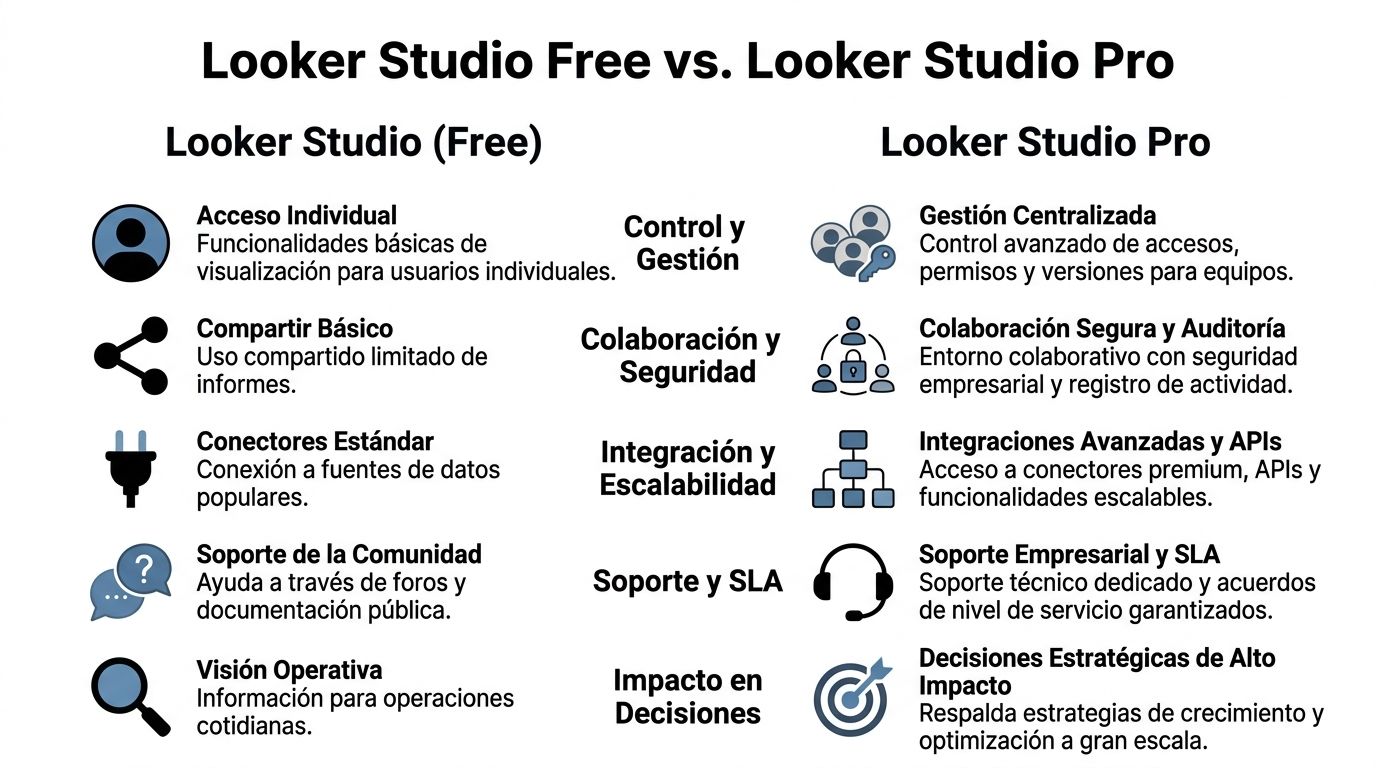
If you work with several stakeholders, multiple brands or distributed teams, you need more control. That is where Looker Studio Pro comes in.
According to W-Lab, Looker Studio Pro is relevant for marketing directors in Chile in a context where the digital advertising market is projected at US$1.2 billion for 2026. The same reference indicates that it can improve site performance by 22% through predictive UX analysis and that its ability to process 500k daily events with low latency has made it possible to take conversions in Shopify stores from 2.1% to 4.3% in local cases.
That does not automatically make Pro a mandatory purchase. It does make it a serious decision for companies that already operate with real complexity.
For a quick visual review, this video helps understand that difference from a practical perspective.
In that scenario, some companies choose to build their own executive dashboards and others turn to partners that already work this analytics layer. One example is the approach of Looker Studio Pro oriented to executive tracking, designed to review trends, attribution and performance without depending on manual reports.
Looker Studio is not magic. If you treat it as an automatic solution, it will disappoint you.

The first limit is expectation. Many companies believe that connecting sources equals having intelligence. It does not. If the source data is mislabeled, if the funnel is not well defined or if each team uses different criteria, the dashboard only accelerates confusion.
The second limit is economic. According to Hiberus, content about this tool tends to ignore important restrictions for GEO-SEO and B2B lead analysis in Chile. That same reference notes that 45% of organic traffic is local, that regional adoption of AI features is 22% versus 48% in the U.S., and that there are hidden costs in connectors of US$50 to US$200 per month. It also indicates that 62% of SMEs still prefer Excel.
For B2B companies, especially when there are forms, multiple touchpoints and long cycles, Looker Studio needs a serious data architecture behind it. For GEO-SEO, something similar happens. Search Console helps, but without an integration strategy the local reading remains incomplete.
The tool is powerful. The judgment with which it is implemented defines whether it delivers clarity or just more screens.
The best answer to what Looker Studio is does not lie in a technical definition. It lies in the cultural change it triggers when a company stops operating on intuition and starts deciding with a shared reading of the business.
In eCommerce, that means defending margin in addition to sales. In B2B, it means stopping measuring volume and starting to measure commercial quality. In both cases, it means something more important: growing without depending solely on continuing to buy traffic.
Looker Studio works when it forces you to order priorities, language and focus. If it does not do that, it is just another dashboard.
If your company already has data but still lacks clarity, Bigbuda can help you turn scattered measurement into a useful executive reading for eCommerce and B2B businesses. The goal is not to report more. It is to decide better.