


Solutions
Explore how to grow
The Net Promoter Score, or NPS, is much more than a satisfaction survey. It's a strategic management system that starts from one key question: “On a scale of 0 to 10, how likely are you to recommend our company to a friend or colleague?”
If you'd like to go deeper, check out our digital marketing service.
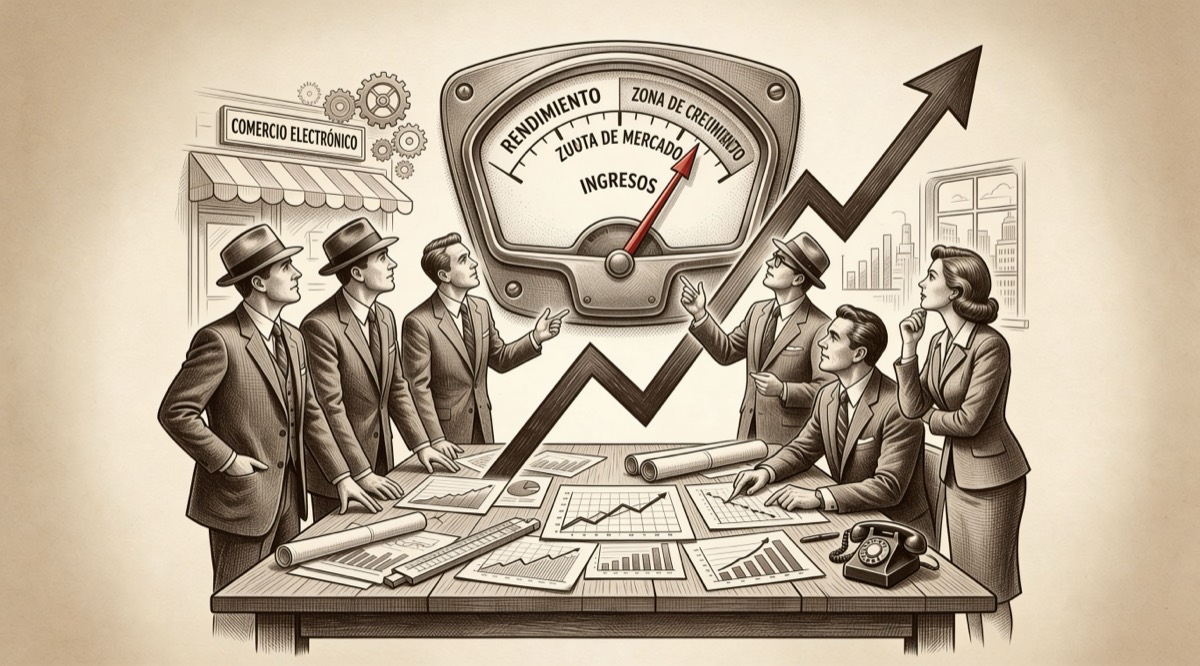
The answer isn't just a number; it's a direct thermometer of your customers' loyalty and, by extension, a predictor of the growth your business can expect. However, its true value lies not in measuring for the sake of measuring, but in how that information is used to make strategic decisions.
If you lead a company, you probably already measure web traffic or sales volume. Those metrics are vital, but they don't tell the whole story. The engine of sustainable growth isn't how many people visit you, but how many become active promoters of your brand.
This is where NPS becomes a fundamental strategic tool.
Think of NPS as a diagnosis of the health of your relationship with customers. It doesn't evaluate an isolated transaction, but the overall perception of your brand. A high score indicates a solid, loyal customer base, willing to defend you. A low score, on the other hand, is an early warning: there are frictions in the experience that are holding back your growth and putting your reputation at risk.
NPS isn't just an indicator; it's a bridge between customer experience and financial results. Its strategic value lies in its simplicity and in the direct correlation between a good score and business performance.
In a competitive market, where customer experience is the main differentiator, managing NPS is decisive. Understanding it isn't just about knowing what the acronym means, but about knowing how to use the methodology to drive the business.
NPS transforms the abstract concept of "customer satisfaction" into a concrete performance indicator. It lets you move from assuming what your customers want to knowing what drives their loyalty and what's pushing them away.
This metric helps you classify your customers into three groups, each with a different impact on your growth strategy.
This table summarizes the customer profiles NPS will help you identify, explaining the strategic impact each group has on your business.
Type of CustomerScore (0-10)Strategic Impact on Your BusinessPromoters9 - 10They're your brand ambassadors. They generate organic growth through word of mouth, buy more often, and are less price-sensitive. They're your main growth asset.Passives7 - 8They're satisfied, but not loyal. They're vulnerable to the competition's offers and don't generate active recommendations. They represent an opportunity for improvement and a risk of silent churn.Detractors0 - 6They're unhappy customers. They can damage your reputation with negative comments and increase churn. They require immediate intervention to mitigate the damage and turn friction into learning.
Understanding these three profiles is the first step to designing specific actions. You should empower Promoters, turn Passives into loyal customers, and listen to Detractors to solve their problems and improve your operation.
If you want to dig deeper into how this loyalty translates directly into profitability, we recommend reading our article on the importance of customer loyalty.
Understanding how the Net Promoter Score is calculated is simple. What's really powerful is what that number tells you about your business's health and, above all, its growth potential.
The formula is straightforward:
% of Promoter Customers – % of Detractor Customers = NPS
The result is a score that ranges from -100 (an absolute disaster) to +100 (maximum loyalty). But the number on its own is a vanity metric; its true value emerges when you analyze the why behind the percentages.
Let's imagine two ecommerce companies, each with 1,000 customers. At first glance, they might seem similar in sales, but their future growth potential is radically different.
Both companies have the same "brake" (20% Detractors). However, Company A has a much more powerful "engine": a base of loyal customers who actively recommend it. Company B, on the other hand, depends on a silent, vulnerable majority that could leave for the competition at the first attractive offer.
The following conceptual map illustrates how the feedback from these groups becomes a lever for strategic growth.
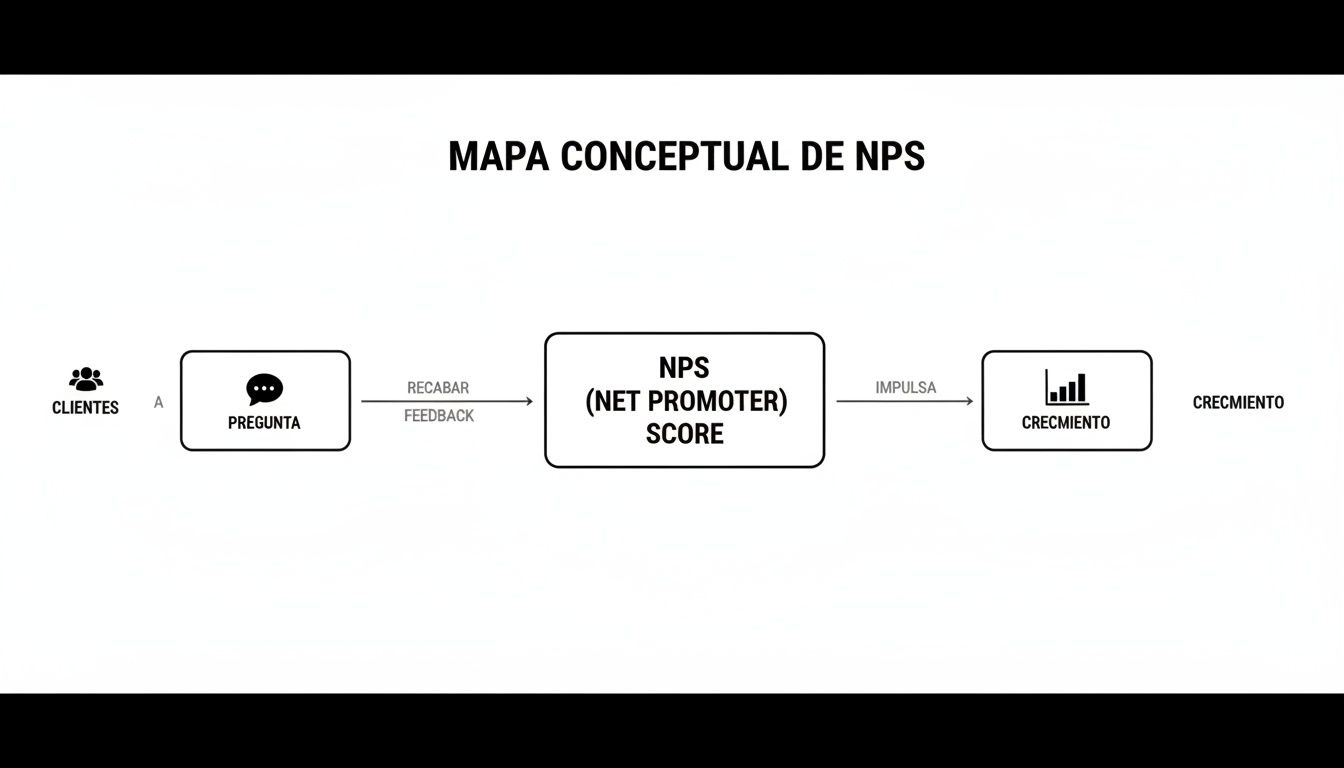
As you can see, NPS isn't a static metric, but a cycle that transforms the voice of the customer into sustainable growth for the business.
You might wonder why Passive customers (a score of 7 or 8) are excluded from the formula. The reason is strategic.
Passives are neutral: they don't drive growth, but they don't actively hold it back either. They're satisfied, but not committed. They're customers, not fans.
Ignoring them in the formula doesn't mean ignoring them in your strategy. Passives represent, at the same time, your greatest risk of silent churn and your most immediate growth opportunity.
Think of it this way: it's much more efficient to turn a satisfied customer into a loyal promoter than to try to win back the trust of someone who had a terrible experience.
Passives' feedback is pure gold for innovation. Their answers reveal what your experience is missing to go from "fine" to "memorable." Analyzing their comments lets you identify high-impact improvements that tip the balance toward true loyalty and differentiation.
Getting the score is only the first step. The real strategic work begins when you interpret it. A common mistake is to compare your NPS with global benchmarks or with industries unrelated to yours, which leads to mistaken conclusions and unrealistic goals.
Context is everything. An NPS of +30 could be an excellent result for traditional banking, but it would be mediocre for a niche ecommerce store. The industry, the maturity of the business, and, above all, local consumer behaviour are what determine whether your score is good or not.
To correctly interpret your NPS, it's essential to understand the consumer profile in Chile and Latin America. Unlike markets like North America, where ratings tend to be more extreme (either they love the service or they hate it), local consumers tend to be more measured in their evaluation.
A satisfied but not "dazzled" customer will rarely give a 10. They're more likely to rate a 7 or an 8, becoming a Passive. This cultural tendency makes earning Promoters (9 or 10) a greater challenge, so expectations about an "excellent" score must be adjusted to this reality.
For this reason, comparing an NPS of +50 from a company in the U.S. with the same score in Chile can be misleading. The Chilean score is very likely to reflect a more solid level of loyalty and satisfaction, since it was obtained in a culturally more demanding environment.
For your goals to be strategic, you need relevant points of reference. According to data from the NPS & CX Benchmarks report by BARE International Chile, there are clear differences between sectors. Industries like telecommunications or traditional banking tend to have lower scores (between +20 and +40), while retail and ecommerce lead with averages that can exceed +50 or +60. Understanding how these rankings work and their impact is key to evaluating your competitive position.
Your NPS score isn't a final grade. It's a competitive compass that tells you where you stand, not on a global map, but on the specific battlefield where you compete for your customers' loyalty.
With these nuances, your NPS becomes a business intelligence tool. The following table presents estimated ranges for key industries in Chile, helping you define ambitious but realistic goals.
Use this table as a reference to compare your performance with the estimated averages in key sectors of the Chilean market.
IndustryAverage NPS RangeExperience Competitiveness LevelBanking and Financial Services+15 to +35HighTelecommunications+20 to +40Very HighRetail (Department Stores)+30 to +50HigheCommerce (General)+40 to +60Very HighSoftware as a Service (SaaS)+45 to +65VariableHealth and Insurance+10 to +30Moderate
These ranges are dynamic. An NPS of +45 in the insurance industry could be outstanding, but that same score in ecommerce would indicate significant room to improve and differentiate through customer experience.
The true power of NPS doesn't lie in the score, but in the why hidden behind it. The qualitative comments, especially those from Detractors, are a gold mine for business strategy.
Think of every negative comment as free consulting that tells you exactly where you're losing money. They aren't complaints, they're diagnoses. They're a map that connects the frictions in the customer experience directly with the revenue leaks in your business.
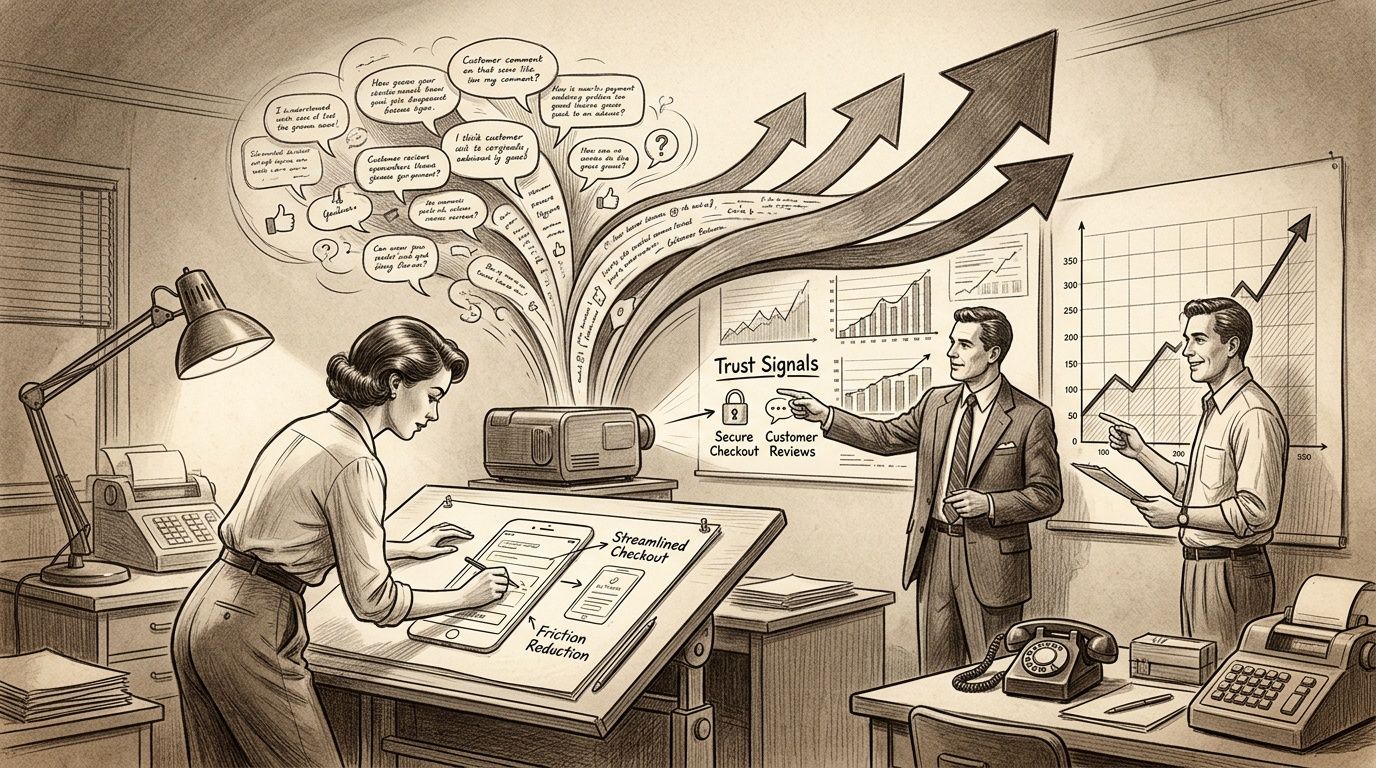
Detractors' comments are a direct reflection of the obstacles holding back your conversion rate. NPS is, therefore, a business optimization tool.
For example, it's common to find patterns like these:
These insights are infinitely more valuable than any vanity metric. They're telling you exactly where and why you're losing business opportunities. When we detect low scores, we analyze the exact friction point and execute concrete improvements, such as simplifying forms or adjusting the value proposition to reduce friction.
A low NPS score isn't a failure. It's a growth opportunity signposted in neon lights. Every Detractor comment is a clue pointing to a direct improvement in your conversion rate and, therefore, in your return on investment.
Once the friction point is identified, the next step is to turn that insight into a strategic action. This is where NPS converges with Conversion Rate Optimization (CRO). If you're interested in going deeper, we recommend reading about what CRO is and its importance for the business.
The process for transforming feedback into revenue is logical and measurable:
This cycle is the engine of a sustainable growth strategy. It's not about spending more to attract traffic, but about optimizing the experience to better convert the traffic you already have.
Implementing an NPS system isn't about sending out an annual survey. It's about creating a constant pulse that informs you in real time about the health of your relationship with customers. The goal is to transform feedback into an engine of business intelligence.
A well-designed system stops being an operational task and becomes a source of insights that fuels everything from web experience optimization to product strategy.
The most common mistake is launching generic surveys without considering context. Asking a customer whether they'd recommend you months after their last purchase yields vague, hardly actionable data. For feedback to be useful, it should be requested at the "moment of truth."
These are some key inflection points for measuring transactional NPS:
Measuring at these key points provides specific feedback that lets you isolate problems and opportunities in concrete areas of the business.
An intelligent NPS system doesn't ask "how's everything?" generically. It asks "how was this specific experience?" right when it just happened, capturing perception at the precise moment.
The 0-to-10 question is just the beginning. The real gold mine is in the open-ended question that follows: “What is the main reason for your score?”
However, to get a complete view, you can't rely solely on what people say. It's essential to cross-reference the qualitative answers with real behavioural data. We combine NPS surveys with tools like heatmaps, session recordings, and click analysis to complement the subjective feedback with objective evidence.
When you cross what customers say (NPS) with what they do (their behaviour on the site), you eliminate the guesswork. For example, if Detractors mention that payment is "complicated," the session recordings can show exactly at which step they get stuck or why they abandon the cart. This combination, which platforms like HubSpot allow you to integrate very effectively, lets you connect experience problems directly with business metrics.
To illustrate the strategic power of NPS, let's analyze the real case of an ecommerce store with high traffic but stagnant sales. The surface-level analysis suggested a traffic-quality problem, but our hypothesis pointed to friction in the experience.
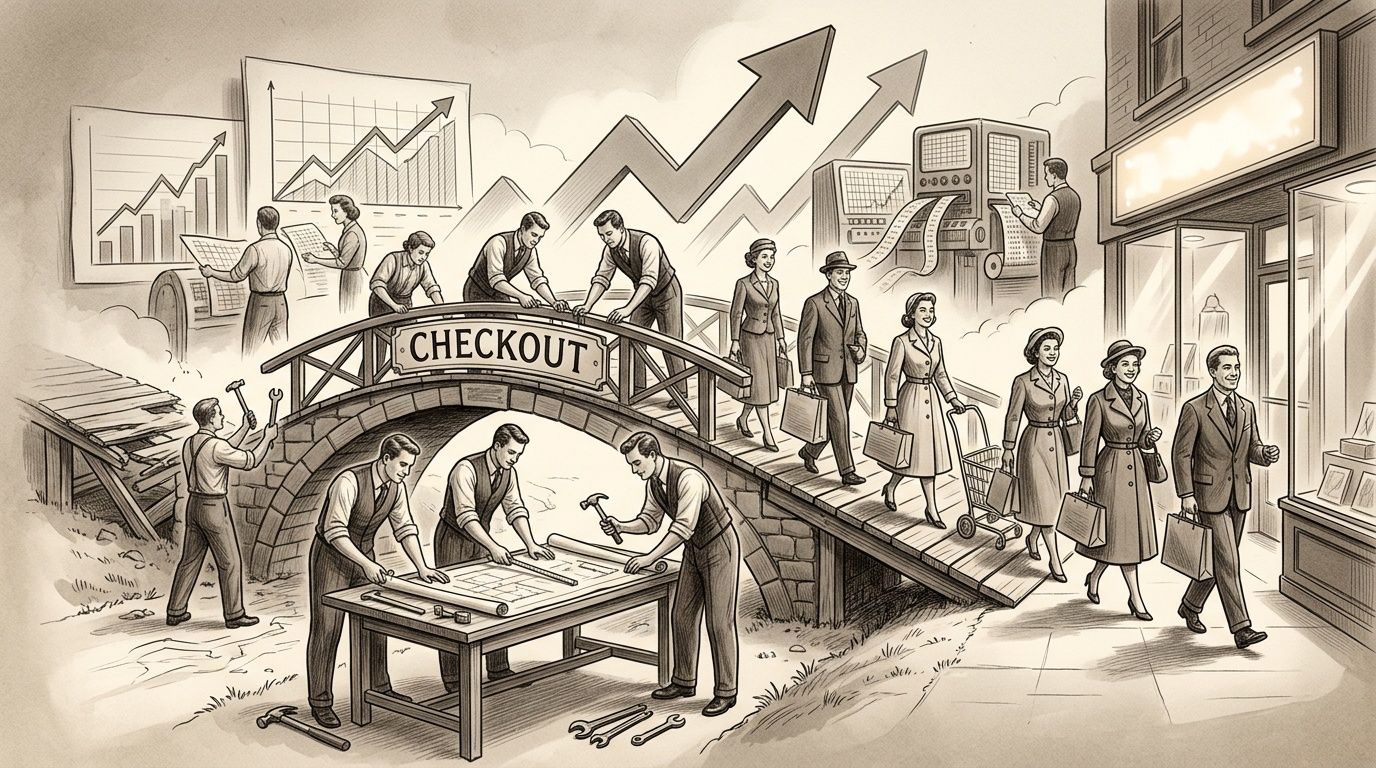
We implemented transactional NPS surveys at key points in the funnel. The results were conclusive: a high concentration of Detractors (scores of 0 to 6) whose comments pointed to a single friction point: the payment process. Words like “distrust,” “complicated,” and “dubious” came up constantly.
This finding was crucial. The problem wasn't the product or the price, but a trust barrier that was destroying conversion at the most critical moment. NPS gave us the certainty that the greatest growth potential wasn't in attracting more traffic, but in fixing an obvious leak in the funnel.
With this diagnosis, the roadmap was clear. The actions focused on directly attacking the causes the customers themselves flagged:
In this case, we detected through the feedback that users actively distrusted the payment process. The redesign focused on rebuilding that trust.
The results validated the strategy and demonstrated the ROI of listening to customers:
This case shows that understanding what a low NPS really means is the first step to unlocking growth. It's not a metric for a report, but a strategic diagnostic tool that guides the decisions that directly impact profitability.
To maximize the value of NPS, it's essential to resolve the key doubts business leaders face. Here we answer with a focus on decision-making and growth.
The frequency depends on the goal. For Relational NPS, which measures long-term loyalty to the brand, a quarterly or semi-annual measurement is enough. It's the "panoramic snapshot" of the health of your relationship with customers.
For Transactional NPS, the key is immediacy. It should be triggered right after a key interaction (a purchase, a support query) to capture the perception of that specific experience.
A high NPS is a strong predictor of profitability, but not an automatic guarantee. Promoters tend to spend more, make repeat purchases, and be less price-sensitive. However, the greatest short-term value comes from analyzing the feedback from Detractors.
Resolving the frictions they flag has a direct impact on conversion rate optimization (CRO) and, therefore, on revenue. A high NPS indicates health, but acting on a low NPS drives growth.
Getting quality feedback is a matter of strategy, not luck. To optimize the surveys, we focus on three pillars:
They're two sides of the same coin. A declining NPS is often the first indicator of a future increase in the churn rate.
Managing NPS proactively, especially by listening to Detractors, is the most effective tool for preventing churn. It lets you identify and solve problems before your customers consider leaving for the competition. In competitive markets, retention is the smartest growth strategy.
At Bigbuda, we don't just measure. We work with companies to transform their customers' feedback into business growth. If you need to increase your conversion and profitability without burning budget on more traffic, discover how our CRO and UX methodology can change your game.