


Solutions
Explore how to grow
You have traffic. You have active campaigns. You have a reasonably modern site. And yet, sales or leads aren't taking off at the pace they should.
If you want to dig deeper, take a look at our digital marketing service.
That scenario usually doesn't indicate a visibility problem. It usually indicates a comprehension problem. You know how many people come in, but you don't understand with enough precision why they don't move forward, where they hesitate, at what point they cool off and which interaction ends up pushing the decision. That's where a journey map stops being a UX resource and becomes a business tool.
In Chile, that conversation is no longer theoretical. More than 50% of Chilean companies had already digitalized at least one process by 2022, according to the Ministry of Economy cited by IEP on the customer journey map. That changes the discussion. If a relevant part of the market already operates with digital processes, the challenge isn't entering the digital world. The challenge is organizing increasingly fragmented journeys and converting better within them.
When someone searches "what a journey map is," they often find a schoolbook definition. That's of little use to a CEO or a marketing director. The useful question isn't what it is in the abstract. The useful question is this: how to use it to detect revenue leaks, fix frictions and make better growth decisions.
Your team invests in ads, the site receives visits and the reports show activity. Even so, sales don't grow at the expected pace and leads arrive with friction. That isn't just a traffic problem. It's a problem of reading the journey.
Many companies in Chile still make decisions with a partial view. They look at sessions, clicks and bounce rate, but they don't see how the decision is built across channels, devices and moments. In hybrid journeys, that's expensive. A customer can discover you on Google, compare on marketplaces, check Instagram, message via WhatsApp, visit a store or talk to sales before buying. If you measure only the last touch, you're managing revenue with incomplete information.
The breaking point is usually somewhere else. It's in the sequence of doubts, objections and validations that stall progress.
That's why so many brands conclude that "the site doesn't convert" when the problem is distributed across message, channel, offer, trust and commercial operation. The site is part of a system. It doesn't work alone.
A well-built journey map shows why a visitor doesn't move forward, which contact accelerates the decision and at what exact point revenue is being lost.
That difference matters for the business. Without that reading, marketing increases acquisition investment, sales receives poorly qualified prospects and digital experience tries to fix pages that aren't the main cause of the stagnation.
A journey map serves to organize business decisions with evidence of the customer's real journey. It helps define where to intervene first, which friction has commercial impact and which channel is pushing, stalling or diverting conversion.
In the Chilean context, this matters more because many journeys aren't 100% digital. The customer quotes online and closes by phone. They discover a brand on social media and validate trust in the physical store. They request information via a form and end up buying after talking to a sales rep. If your analysis separates these moments into silos, you lose visibility over the route that actually generates revenue.
The useful question isn't whether you should map the journey. The question is where purchase intent breaks and how much money escapes at that break.
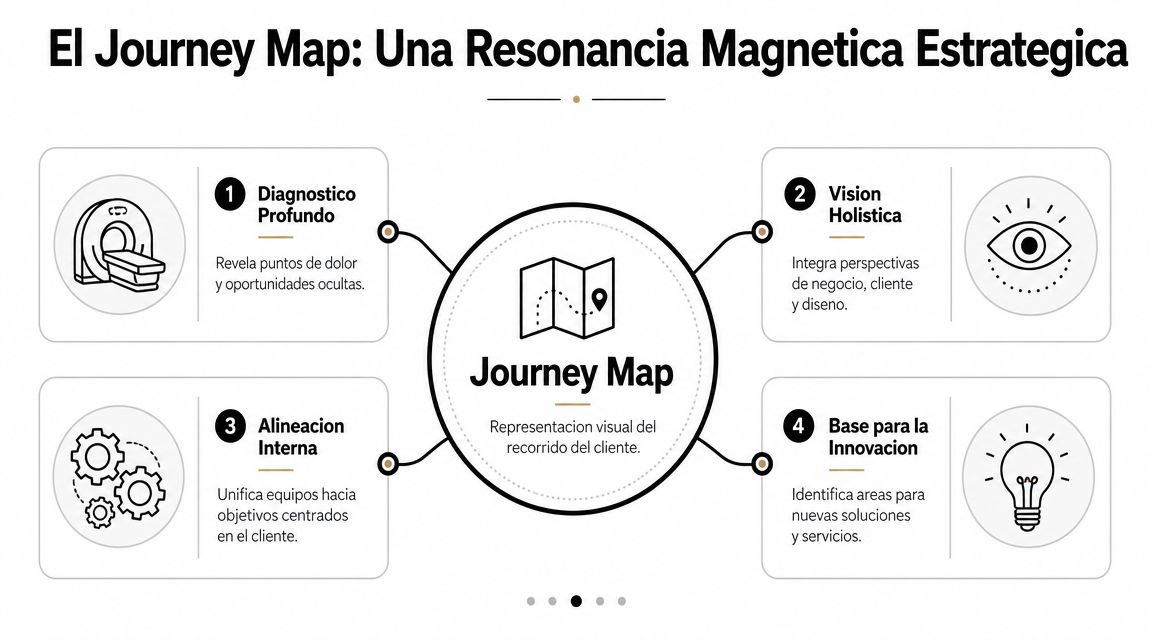
A journey map is a business intelligence tool for understanding how your customer really buys and making better growth decisions.
It serves to identify three things:
That approach changes the internal conversation. You stop debating opinions about "what the user wants" and start prioritizing actions according to their impact on revenue, close speed and commercial efficiency.
Most companies treat the journey map as a visual deliverable. They put it in a presentation, discuss it once and forget it. That approach destroys its value.
A serious journey map works more like an MRI than a simple X-ray. The X-ray shows you general structure. The MRI lets you see tensions, interruptions and critical zones that weren't obvious at first glance. Web analytics plays the X-ray role very well. The journey map completes what's missing.
Google Analytics, Shopify Analytics, HubSpot or GA4 show you what's happening. They tell you which channel brings sessions, which page has an exit or at which step a form drops off. That's fine. But it isn't enough.
The journey map answers something more valuable. Why that behaviour makes sense from the customer's perspective. That distinction changes budget decisions, messaging and internal prioritization.
For example:
Rule of thumb: if your team only sees metrics by channel, it's optimizing loose pieces. If it sees the full journey, it can optimize the system that generates revenue.
That's also why it's worth crossing this approach with a broader reading of the customer journey in digital businesses. The map doesn't replace that vision. It grounds it in decisions.
In Chile, the fragmentation of the journey is especially relevant because digital interaction is constant and mobile. The Undersecretariat of Telecommunications reported more than 24 million mobile and mobile broadband connections in recent years, according to the reference gathered by Miro on what a customer journey map is.
That data matters for a concrete reason. The customer doesn't relate to your brand in a single session or on a single device. They may start on mobile, validate on social media, return from desktop and close via WhatsApp or in store.
A marketing director doesn't need another pretty chart. They need a tool that lets them answer questions like these:
The best effect of a journey map isn't visual. It's political and operational. It forces marketing, sales, service, product and leadership to look at the business from the same journey.
That reduces useless debates. You no longer argue from internal opinions. You argue from evidence of customer behaviour.
A journey map useful for the business isn't built from aesthetics. It's built from strategic questions. If the map doesn't help decide where to invest time, focus or budget, it's incomplete.
IBM defines that the customer journey map captures the experience from the consumer's perspective, including touchpoints, emotions and pain points, and also recommends validating it with real customers, as IBM explains in its definition of the customer journey map. That validation matters because most mistakes are born when the team draws how it believes the customer buys, not how they actually buy.
The first common mistake is starting from the company. The map doesn't revolve around your campaigns, your site or your departments. It revolves around a person or segment with a concrete need.
That requires defining components with executive judgment:
| Component | Strategic description | Key question for the business |
|---|---|---|
| Persona or segment | Defines which type of customer you're analyzing and why that profile matters commercially | Which segment concentrates the best growth or profitability opportunity? |
| Scenario | Delimits the specific context of the journey | What situation triggers this purchase or contact decision? |
| Stages | Orders the customer's progress into an understandable sequence | In which phase does progress slow down or break? |
| Touchpoints | Identifies critical interactions with the brand across online and offline channels | Which contact most influences trust, progress or abandonment? |
| Customer actions | Records what the customer does at each stretch | What concrete behaviour do we want to facilitate or accelerate? |
| Questions and objections | Exposes uncertainties that affect the decision | Which doubt is stalling revenue? |
| Emotions | Makes visible the psychological tone of the journey | Where do anxiety, distrust or confusion appear? |
| Pain points | Shows operational, communicational or UX frictions | Which obstacle should we resolve first? |
| Opportunities | Translates the diagnosis into improvement levers | Which change can unlock the most value with the least effort? |
| KPI by stage | Connects the map with business metrics | How will we know whether the improvement impacted results? |
Many maps stay on the surface because they only describe steps. That contributes little. The decisive part is in the emotional layer and the pain points.
If a page generates confusion, the problem isn't "about content" in the abstract. The problem is that confusion increases doubt, and that doubt stalls the purchase or the form submission. That's where the connection between experience and business appears.
If the map doesn't show emotions, it doesn't show commercial risk. It only describes navigation.
That's why it's worth demanding real validation. Interviews, sales feedback, support tickets, session recordings, heatmaps or WhatsApp conversations can provide valuable signals. The goal isn't to have a perfect document. The goal is to reduce assumptions.
A journey map without activation is diagnosis without impact. It serves to understand, but not to grow. The value appears when the finding becomes a hypothesis and that hypothesis enters a measurable improvement process.
The right logic isn't "let's make changes because the map looks bad." The right logic is much more disciplined.
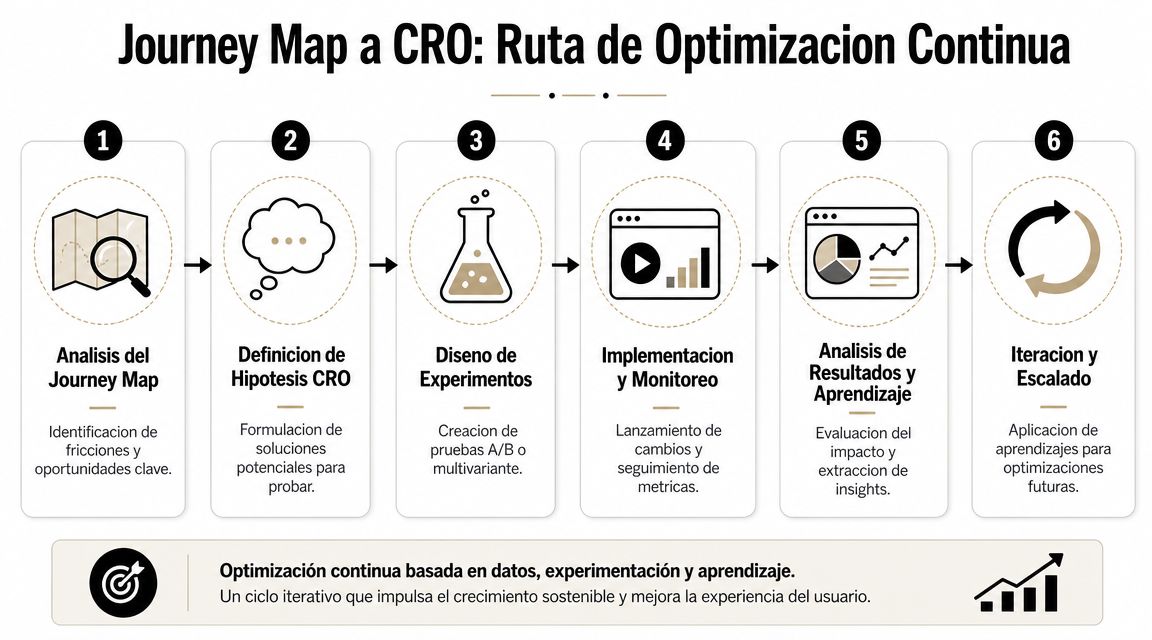
Qualtrics argues that an effective journey map models actions, motivations and pain points by stage, and that this lets you design concrete interventions such as UX improvements, step reduction or CTA optimization to then measure their effect on conversion, as Qualtrics summarizes in its guide on the customer journey map. That's the foundation of a mature CRO process.
The executive flow can be summarized like this:
Detect the friction
The map shows that at a given stage there's a drop in trust, a delay or a repeated doubt.
Translate it into a hypothesis
Saying "we have to improve the page" isn't enough. You have to formulate a plausible cause-effect relationship.
Design a validation
The improvement is tested with an experiment, a controlled change or a bounded intervention.
Measure impact
If progress improves at that stage, it's implemented or scaled. If not, you learn and adjust.
For those working on this at a growth level, it's worth connecting the map with a broader view of what CRO is and how it impacts the business. That's where the bridge between experience and results lies.
In eCommerce, a map can reveal that the problem isn't in the product page, but in the transition between cart and checkout. The customer arrives convinced, but cools off when doubts appear about shipping, timing or security.
In B2B, friction usually appears earlier. The prospect comes in, explores services, but doesn't find enough evidence to trust. They don't abandon for lack of interest. They abandon for lack of certainty.
That completely changes the growth agenda. It's no longer about redesigning by intuition. It's about prioritizing interventions where friction blocks revenue.
A solid CRO program doesn't start from creative ideas. It starts from frictions observed in the journey.
The most expensive mistake is redesigning the entire site because "it's time to update it." Without a journey map, that kind of project tends to attack visible symptoms and leave the commercial problem intact.
The map forces an uncomfortable but profitable discipline. Intervening where it really hurts.
The problem with much content about journey maps is that it still describes a clean, linear funnel. The Chilean reality doesn't work that way. The customer mixes channels, asks via messaging, checks social media, compares marketplaces and often decides outside the site.
That's precisely the question almost no one handles well. How to optimize a journey when the decisive touchpoint isn't on the web. That view stands out in QuestionPro on types of journey maps, when it notes that most content assumes linear funnels and leaves out the hybrid reality.
A customer discovers a product on Instagram. She visits the site. She looks at photos, but doesn't buy. Later she compares the same product on a marketplace. Then she messages via WhatsApp to ask about stock, pickup times and payment methods. Finally she buys with in-store pickup.
That journey has several implications:
If the team only looks at site analytics, it might conclude that Instagram doesn't convert or that the product page doesn't work. The map shows something more precise. The decision depended on a validation sequence among social media, site, messaging and physical operation.
When the customer buys in a hybrid journey, optimizing only the web is stopping halfway.
A marketing manager looks for a provider. They arrive via organic search at a service page. They don't book a meeting. Days later they download a technical resource. Then they attend a webinar or review material sent by email. Later they share the information internally. Only after that does someone on the team request a meeting.
That process shows another reality: in B2B, often the user who researches isn't the one who approves. The journey map must account for that chain.
The critical moments usually aren't visual. They tend to be about credibility:
Although the contexts are different, both journeys share a pattern. The decision is built across several touchpoints and doesn't respect the linearity of the classic funnel.
That forces leaders to think differently:
In Chile, where the relationship between online and offline is especially dynamic, the journey map serves to visualize that mix and make more realistic decisions.
The tool matters less than many believe. A team can create a brilliant map in Miro and change nothing. Another can work a simple version in Google Sheets or FigJam and detect a friction that changes its commercial performance.
The right decision isn't to look for the most sophisticated software. It's to choose the format that makes analysis, conversation and follow-up easier.
The most useful categories tend to be these:
Each format has a different fit.
| Type of tool | Best strategic fit | Main risk |
|---|---|---|
| Collaborative whiteboard | Teams that need to align departments and discuss journeys | Getting stuck in a workshop with no execution |
| Specialized software | Organizations with a continuous customer-experience practice | Over-investing in the tool before validating the process |
| Spreadsheet or document | Pragmatic teams that need clarity and follow-up | Losing visual richness if the analysis is poor |
If you're complementing this reading with on-site behaviour signals, it's also worth reviewing observation tools like those gathered in this guide on the best heatmap tools. They don't replace the map, but they do help give it evidence.
A useful template should allow you to record at least:
What matters isn't that the map looks elegant. What matters is that someone can look at it and answer two questions without beating around the bush: what's stalling progress and what decision we should make now.
A well-used journey map isn't a static document. It's a growth compass. It helps read an environment where the customer switches channels, compares more, validates more and demands coherence between marketing, sales, service and operations.
That's why the search "what a journey map is" should lead to a more ambitious conversation. You aren't looking for a definition. You're looking for a smarter way to decide.
When a company understands the real journey, it stops investing blindly. It stops arguing from internal perceptions. It stops redesigning for no reason. It starts prioritizing improvements where experience blocks revenue, where trust falls apart or where friction prevents progress.
The journey map isn't for drawing what you already know. It's for discovering what you're not yet seeing and that is affecting results.
The leaders who grow best aren't the ones who generate the most activity. They're the ones who best understand the path their customer travels and fix critical leaks sooner.
If your company has traffic, digital investment and a site that doesn't convert at the level it should, Bigbuda can help you read that journey with strategic judgment and turn it into concrete growth decisions.