


Solutions
Explore how to grow

Many companies look at their NPS as a post-sale figure. That approach is too narrow. In Chile, an average NPS in retail and online services hovers around 25 to 35 points, according to Praxis. If you use it only to report satisfaction, you are leaving out its real value: anticipating retention, referrals and commercial friction before seeing it reflected in revenue.
This is reinforced by a strong digital marketing service.
The point is not to learn how NPS is calculated for general knowledge. The point is to turn that formula into a business signal. A CEO does not need another pretty metric. They need an indicator that helps decide where to fix experience, where to prioritize investment and which segments are pushing growth or holding it back.
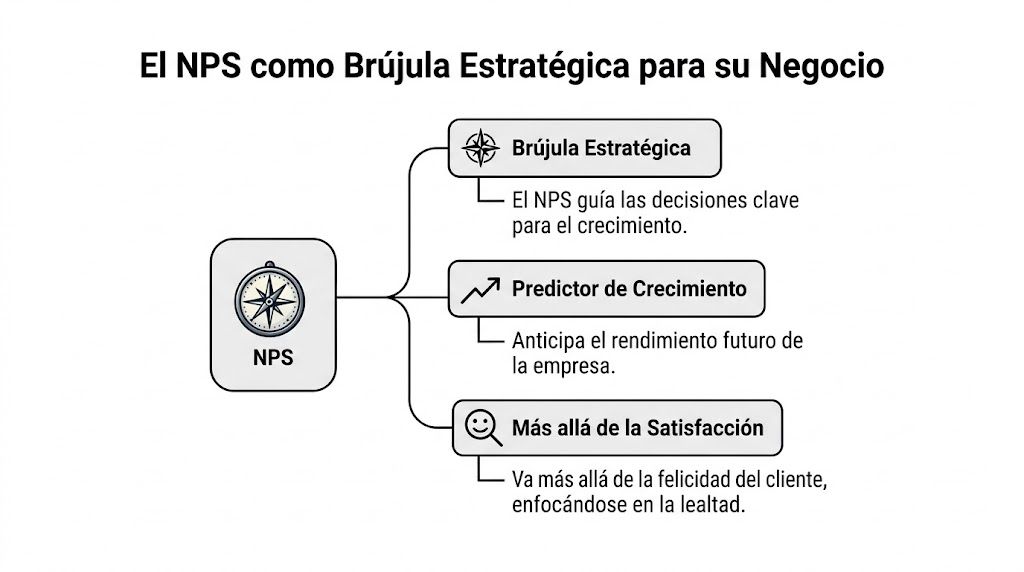
NPS defines whether your growth is building brand or accumulating friction. A CEO should not see it as an isolated experience metric, but as an early signal of future revenue, pressure on retention and a real ability to expand without depending more and more on CAC.
The formula matters, but here what is decisive is its use. As explained earlier, NPS compares promoters against detractors. What changes the business result is not the calculation itself, but the discipline to connect it with repurchase, referrals, conversion and commercial close.
A high NPS, on its own, does not make payroll. But a weak NPS does usually anticipate problems that later appear in revenue. In Chilean eCommerce, that usually shows up first in deliveries that do not meet expectations, gaps between the commercial promise and the real experience, slow support or a mobile purchase that adds friction right where it should make things easier. In B2B, the pattern changes in form, not in essence. Slow onboarding, poor adoption, little clarity of value and stalled accounts end up eroding renewal and expansion.
That is why it is worth treating NPS as a leading indicator. If it falls, review processes before reviewing excuses. If it rises in a sustained way in profitable segments, there is a concrete clue to decide where to invest in CRO, service and value proposition.
Practical rule: if your NPS does not talk to sales, retention and performance, you are measuring opinion. You are not managing growth.
Satisfaction and recommendation are not equivalent. A customer can state they were satisfied and still not bring a referral, not repurchase or not defend your brand against the competition. For a company that wants to grow in Chile, that nuance matters a lot. The market quickly punishes mediocre experiences and strongly rewards brands that deliver on what they promise.
The strategic value of NPS is that it forces prioritization. Promoters show which part of the experience does generate transferable trust. Detractors show where the journey breaks and where it is best to intervene first to recover conversion, margin or retention.
If you want to align that reading with business decisions, review this guide on what NPS really means for a growing company.
The mechanics are simple. The interpretation is not. That is the difference between a company that "measures NPS" and one that uses it well.

To understand how NPS is calculated, first classify the responses to the recommendation question on a scale of 0 to 10:
Then apply this logic:
That exclusion tends to confuse. But it makes sense. Passives do not actively push growth nor hold it back with the same intensity. They do not disappear from the strategy, but they do leave the calculation.
SurveyMonkey offers a practical example worth memorizing. If you have 100 responses, with 70 promoters, 20 passives and 10 detractors, your NPS is 60. The operation is direct: 70% minus 10%.
That same data matters more when connected to business. According to the same reference, in Chile eCommerce stores with an NPS above 50 grow 25% annually, while those with an NPS below 20 grow 12%.
An NPS is not good because "it looks high." It is good if it helps explain why one unit grows more efficiently than another.
The common mistakes are not in the subtraction. They are in the context. Three failures ruin the executive reading of the indicator:
For those who prefer a visual explanation before taking it to the committee or the board, this resource summarizes the logic of the calculation well:
A mature company does not ask "what was the NPS?". It asks "what part of the experience is creating promoters and which is manufacturing detractors?". That difference changes the conversation.
If your team celebrates the score but cannot name the causes of the low ratings, you are not yet managing NPS. You are just collecting responses.
Aggregate NPS is convenient. It is also dangerous. It averages incompatible realities and tends to hide the exact problem that is holding back conversion.
A common example: the company sees a healthy overall NPS and concludes that the experience is under control. But when it segments, it discovers that recurring customers value the brand, while new ones arrive with expectations that the site, the offer or the commercial process do not meet. That is where the indicator's true executive use appears.
When you look at a single NPS for the whole business, you lose decision-making power. A marketing director needs to know which source brings customers with better disposition. A commercial manager needs to see which type of account becomes a promoter. A CEO needs to detect where growth is being bought at the expense of a weak experience.
Segment with business judgment, not by operational habit. The most useful divisions tend to be:
To deepen that approach, it is worth reviewing how the customer journey is analyzed in digital growth contexts.
Segmentation does not serve to decorate reports. It serves to assign priority. If a segment brings volume but produces detractors, that channel needs review before continuing to scale. If another generates less volume but more promoters, there may be an underestimated competitive advantage there.
| Customer Segment | Overall NPS | Strategic Insight |
|---|---|---|
| New customers from paid | Low or negative | Review the commercial promise, offer expectation and continuity between ad and site |
| Recurring customers | High | Identify which part of the experience generates trust and replicate it |
| Organic traffic | Medium to high | Usually indicates better alignment between intent and value proposition |
| Long-cycle B2B accounts | Volatile | Interpret alongside qualitative signals and complementary metrics |
| Premium product buyers | May diverge from the average | If they demand more, they also expose critical frictions sooner |
Segmented NPS orders the roadmap better than many opinion meetings. It tells you where to act first.
If a channel grows but brings detractors, it is not creating value. It is buying friction.
Use segmentation to answer hard questions:
When NPS is cross-referenced with acquisition, retention and customer value, it stops being an experience metric and becomes a map of resource allocation. That is far more useful than wondering whether the score "looks good."
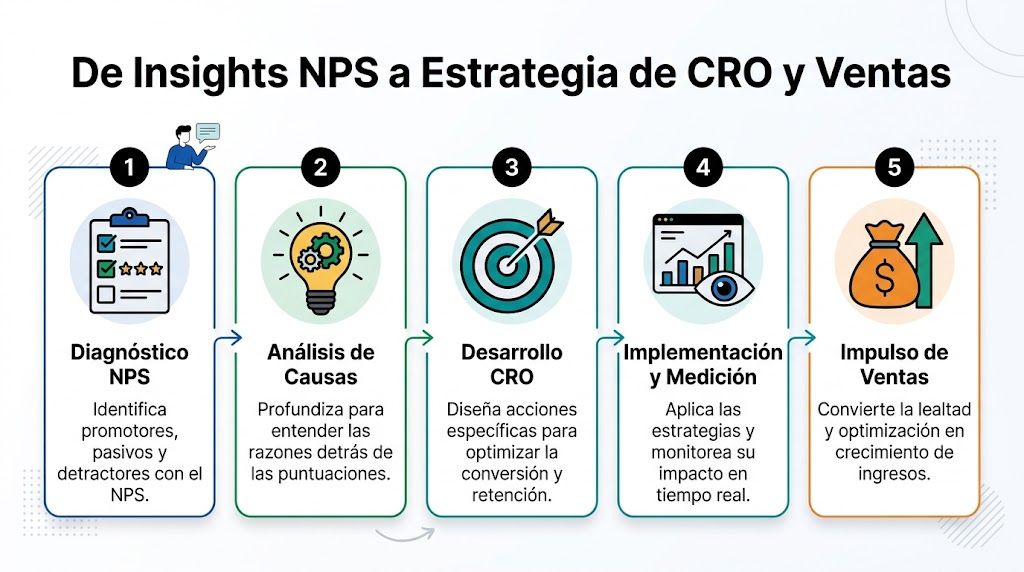
This is where most fail. They calculate the score, compare it with a benchmark and file it away. That does not improve revenue. What improves revenue is turning the voice of the customer into decisions about experience, value proposition and commercial friction.
According to Zenvia, an advanced methodology uses the Excel formula **=((COUNTIF(POINTS,">=9")-COUNTIF(POINTS,"<=6"))/COUNT(POINTS))100*. That same source indicates that in Santiago NPS correlates at 0.72 with the increase in conversion rate, and that sites with an NPS above 40 see 15% more qualified leads. That relationship is the relevant clue for a growth leader: perceived experience and commercial efficiency move together more than many teams admit.
You do not need to turn every comment into an initiative. You need a filter. This one works well at the executive level:
Detect the pattern
Read the open responses and group recurring causes. Not by cosmetic theme, but by impact on purchase decision, trust and retention.
Locate the friction in the journey
A criticism of checkout is not the same as a criticism of after-sales. One affects immediate conversion. The other affects repurchase, referrals and brand perception.
Prioritize by commercial impact
If the criticism appears in high-value accounts, in new segments or in expensive channels, it moves up in priority.
Translate the insight into a hypothesis
"Customers do not understand total costs," "the proposition creates ambiguous expectations," "the commercial process asks for too much effort."
Measure the change in business, not just in experience
If the adjustment improves NPS but does not move lead quality, conversion or retention, its impact is limited.
Suppose detractors repeat one idea: the experience is not clear. A tactical team will keep debating design. A growth team will ask better questions.
To better understand that logic of continuous improvement, it is worth connecting NPS with a broader view on what CRO is and how it impacts growth.
The best use of NPS is not to measure loyalty. It is to uncover what is blocking conversion before sales reports it as a "difficult market."
If an improvement project cannot link a cause of detraction with a commercial hypothesis, it should not enter the roadmap first. NPS helps filter "interesting" initiatives from profitable ones.
Think of it this way:
The key is not to raise the score for its own sake. The key is to use it to decide which frictions to fix first, which segments to protect and which part of the experience deserves more investment because it has an effect on revenue.
NPS is not untouchable. Nor is it enough on its own. In Chilean B2B businesses, its reading can become incomplete if used as the only signal of commercial health.

According to Inesdi, a contrarian perspective shows that in Chilean B2B the average NPS is 22, compared with 38 in eCommerce. That contrast matters because long cycles, multiple decision-makers and gradual expectations make the promoters-versus-detractors logic lose part of its sensitivity.
In those contexts, ignoring the passives can be a strategic mistake. Often they are not dissatisfied. They are waiting for evidence, support, consistency or results. If you leave them out of the executive reading, you may miss early signals of stagnation.
The most interesting trend is not collecting more forms. It is reading better what you already have. The same source notes, as a projection for 2026, that predictive NPS with AI can predict churn 25% better by analyzing the feedback of passive customers.
That changes the use of the indicator. It is no longer just about counting who would recommend. It is about identifying language patterns, recurring themes and risk before an open drop in the rating appears.
A score without qualitative analysis is an alarm without a diagnosis.
Do not replace NPS. Complement it. Especially if you sell services, complex solutions or long-term contracts.
Three executive recommendations are enough:
The future of NPS will not be a more sophisticated number. It will be a better ability to anticipate customer behavior from weak signals. The companies that understand that will react sooner.
Classify the responses into promoters, passives and detractors. Then subtract the percentage of detractors from the percentage of promoters. The passives do not enter the final formula.
Not always. It means there is a customer base more willing to recommend you. That is usually a good sign, but it only gains executive value when connected with retention, growth by channel and sales quality.
It depends on the sector. In retail and online services in Chile, the average range reported by Praxis moves between 25 and 35 points. That makes contextual comparison more useful than an obsession with an absolute number.
Yes. A lot. They are customers who are neither pushing growth nor destroying it explicitly, but they can lean toward either side. In B2B, ignoring them can distort the reading.
At a frequency that allows you to detect changes and make decisions. The exact periodicity depends on the type of business, the volume of interaction and the moment in the journey you want to evaluate. What matters is to sustain consistency and compare under equivalent criteria.
Yes, if you segment it and cross-reference it with business. As an isolated score it helps little. As a signal to decide where there is friction, which segment is worth protecting and which part of the experience is holding back sales, it helps a lot.
If your company wants to transform experience metrics into growth decisions, Bigbuda can help you connect data, CRO, UX and artificial intelligence to turn the same traffic into more sales, better leads and a more profitable digital operation.